1

ECB meeting 7 September 2017, what to expect:

In late June at the ECB Forum in Sintra, the ECB Chairman Mario Draghi remarked that “all the signs now point to a strengthening and broadening recovery in the euro area.” The market took this as a sign of the impending end to QE and the EUR began a rally from 112 to 119 and change. The ECB was quick to moderate the message soon after Draghi’s remarks. More recently the ECB has expressed concerns about the strength of the EUR, and at Jackson Hole this week, Draghi was careful not to telegraph any intentions as to the future trajectory of QE or interest rates.

On Sep 7 next week, the ECB will meet to decide on monetary policy. It is clear that the Eurozone economy has stabilized and is in the middle of a cyclical upturn, led mostly by Germany. However, growth rates are not equal, nor are labour markets. The variation of unemployment in the Eurozone ranges from 3.8% in Germany to 21.7% in Greece with Italy at 11.1% and the Euro area average at 9.5%. Greece and Ireland have negative rates of inflation with the region average at 1.4% while economic powerhouse Germany manages only 1.67%.

Given the ECB’s mandate of 2% target inflation, it is clear that policy has not achieved its aims. Not only that, it exposes the fact that policy is unable to address the varying growth, unemployment and inflation rates of the member countries. The single currency may have brought about convergence in interest rates up until 2008 but it has if anything exacerbated divergences in factor prices in the Eurozone, as conventional economics predicts it should if member countries have different factor productivity, which they do.

Not only has policy not achieved its aims but the current QE will run into technical difficulties. By buying bonds pro rata to the capital key, the ECB’s accommodation is strongest in Germany and weakest in the periphery. The limitations on how much of each issue the ECB (and by extension the national central banks) can buy and the issuance of bunds means that the ECB will not be able to maintain its volume of bund purchases much longer. Since it has to buy according to the capital key, this limits how much it can buy of peripheral bonds. The ECB may have to taper its asset purchases simply because it runs out of bunds to buy.

What the ECB needs to do is to find a way of buying or enabling the buying of, Eurozone bonds according to the needs of each economy, and not according to the capital key. Given how the rules are drawn up, and the opposition it faces from the Bundesbank, it will not be able to directly buy bonds. It will likely have to resort to a mechanism it first engaged in late 2011, the unconditional LTRO.

Why the original LTRO worked:

The national private commercial banks bought bonds which the ECB could not. As long as the bonds they bought were eligible collateral, and had a yield above zero, private commercial banks would have an incentive to buy them, since they could be financed effectively at 0% in the LTRO.

The original LTROs were not conditional on the size of banks’ loan books. Banks could buy as much of sovereign bonds as they liked with LTRO money. Under the later TLTROs, the size of their LTRO utilization was conditional on their loan books. If the banks could not or would not increase their loan books, they could not increase their LTRO participation. This is one reason why TLTRO take up (some 400 billion EUR) was much smaller than LTRO take up (which topped a trillion EUR).

The LTRO is ideal in encouraging private commercial banks to perform proxy-QE for the ECB, and would circumvent the capital key. Assuming that the single currency did not break up, banks would be incentivised to buy bonds of Italy, Spain and Portugal, where yields were highest, and not bonds of France and Germany where yields were tightest, and up to 10 year, negative. Assuming that there was some default risk and break up risk, at least the national private commercial banks of Italy, Spain and Portugal would buy their own respective national debt. If nothing else this would push also their current accounts further into surplus and narrow the spreads to French and German bonds.

If we believe that the ECB intends this route, then we also know that they are unlikely to raise interest rates since the LTROs require super cheap funding to work.

The September 7 ECB meeting is very much up in the air. The last 3 months have seen conflicting signals and some clumsy communications by the ECB. I believe that in the current environment, the ECB will do the following:

1. Hold interest rates at -0.4%.

2. Announce a tapering of bond purchases in the public and private markets.

3. Announce a resumption of unconditional LTRO up to a size of 1 trillion EUR over the next 12 months.

The consequences of this, based on lessons and parallels drawn from Dec 2011, could be:

1. Exert downward pressure on the EUR.

2. Bring convergence between peripheral rates and bunds.

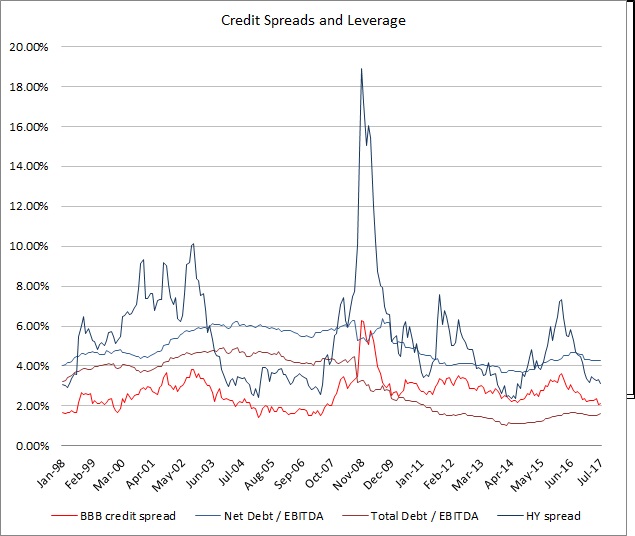
3. Trigger a rally in EUR high yield.

4. Impact on equities not so certain.


Why inflation is low and central banks are confused and what can be done about it.

For central banks the world over, inflation is too low, apparently. Continued efforts to reflate economies have led to some growth and employment but have not had much impact on inflation. As asset markets make new highs and valuations get more stretched, labour markets become tighter and growth stabilizes, central banks are at a loss as to why their policies have not created more inflation. Despite highly accommodative policies we continue to see weak consumer price inflation and weak wage growth.

One distinction that perhaps blunts measurement is that there are various strata of society and each has their own consumption patterns and thus price baskets. From 1982 – 2016, the Forbes Cost of Living Extremely Well Index (CLEWI), has risen at 5% per annum compared with the CPI which rose at 3% per annum. A 2% gap over 35 years adds up. Manhattan luxury housing has risen at a pace of over 6% p.a. over the last 10 years compared with 0% for the Case Shiller 20 City Composite Index. Coutts Luxury Price Index rose 6% YOY compared with a UK CPI of 2% and in China, the Hurun Luxury Price Index rose at 3.6% July YOY compared with a CPI of 1.4%.

Aggregate CPI numbers are blunted by acute inequality. The CPI basket is weighted towards goods which for the rich are at saturation and for the poor are facing low demand. The economy relevant to the rich is vibrant, healthy and inflationary. For the poor, stagnant wages and a shrinking share output and income cap demand.

Central bank efforts have not targeted the right areas, which are employment and real output. By focusing on asset solutions and funding costs, regulators have enriched those with outsized access to credit and high exposure to investments in assets. By suppressing the USD yield curve, the Fed supports higher valuations for equities and credit which are generally owned by higher income and more wealthy people. This section of society, being wealthier, save a greater proportion of incremental wealth so that the wealth creation fails to trickle down and the velocity of money falls, limiting the transmission towards higher inflation.

Low interest rates also alter the labour to capital mix by distorting prices. Low interest rates and easy access to credit encourages investment in fixed capital relative to labour. A firm can borrow to fund wages but it the cheaper credit becomes the cheaper it is to invest in fixed capital that can be depreciated aggressively increasing the returns on investment in future time periods. Put simply, a firm can own fixed capital but it can only rent labour. When rates are low, it makes sense to own your factors of production rather than rent them. Low rates skew the labour capital mix and suppress wages.

Another effect is that as QE was undertaken, inflation expectations were raised. Conventional economics indicates that rate cuts and monetary expansion lead to higher inflation. This did not happen. Instead inflation was low and assets rose. The inflation to money supply relationship is not precise and since there is a vector of goods and prices, it is not clear in which goods markets the inflation will take place in. If there is excess capacity in a particular market, even if demand manifests there, output may rise to compensate for any inflationary pressure and prices might even fall, theoretically. To complicate matters, for all practical intents and purposes, this vector of markets into which money could flow includes not only goods and services but assets as well. If inflation expectations were being driven up the response could have been to consume in the current period or to buy claims on future production, in other words, equities or high yielding credit.


Policy needs to look not only at aggregates but also at the structure of an economy. A country has to decide if its policy is there to serve the many or the few, the rich or the poor. And while the right answer is obvious so is the outcome. Even assuming away cynical behaviour, any policy that favours the poor against the rich, in relative or absolute terms, will likely encourage tax or regulatory arbitrage. An internationally coordinated solution is needed to ensure that if tax advantages are sought then they are the result of true immigration. This is difficult but adoption of Common Reporting Standards, for example, are a step in the right direction.

An internationally coordinated tax system would either require convergence of tax rates, or will encourage physical or true immigration, sometimes to the detriment of the source country. Tax convergence is unreasonable given the needs of individual countries. A tiered global, national, state tax system might be a solution but the coordination it would require to design let alone implement is still far away.

Tax funded transfers are only one way of addressing inequality, not just of wealth but of impact on the economy. A better understanding of how interest rates impact the economy at the micro level will also make for better central bank policy. Current efficacy of policy has been questioned not just by the public but by central banks themselves. To carry on a policy when its impact is not well understood is inadvisable.

The distortionary impact of interest rate policy on business planning could advise a tax code that applied a policy-externality-weighted expense system to calculate tax credits to compensate. To encourage a reduction in youth unemployment, a company hiring under 25’s could deduct more than 100% of their wage costs when calculating their taxable income, for example. Such a system of weighted expense tax deductibility could be used to fine tune behaviour to achieve policy goals.

Compensatory training and skills upgrading could be provided and tax-funded to lower wealth and income people to reduce the skills gap and narrow the potential wealth trajectory.

Real estate taxes can also narrow the wealth gap as real estate is a significant store of wealth. Real estate should be a resource or used for dwelling and not investment. Supernormal profits should be taxed and used to fund the less wealthy.

The purpose of these apparently socialist and redistributive policies is not to pursue a social agenda but to address a fundamental inadequacy of policy. Its aims are to increase development, growth and employment for the majority of the population and not an aggregate that is highly skewed because of acute inequality. It is hoped that by rethinking and redesigning policy, the interests of the many are served over the interests of the few.


Dumb Forecast For S&P500 Returns

Let us say that you have made 16% per annum for the past 2 years investing in the S&P500. As at this point, you have.

What is the return you would have to make over the next 2 years so that your 4 year average return was equal to the long term potential return of the S&P500?

The 63 year historical average return of the S&P500 is about 10%. I used data from 1954 to the present because that’s all I could get. Sorry. If you compounded at 16% for the past 2 years, you would have to make 4.3% p.a. for the next 2 years to bring you back to this average.

What if you thought that long term returns were 7% going forward? Then your next 2 years’ average returns would have to be -1.30% p.a.


Chart of S&P 500 and its Exponential Trend Line:


US Debt Ceiling 2017. Mexican Stand-off Between Republicans Everywhere.

The best thing investors can do about the US debt ceiling issue is to talk about it and do nothing. In 2011, a Democrat White House and a Republican Congress had a similar debate about the debt ceiling. The Obama administration argued that failure to raise the debt ceiling would result in a sovereign default which would lead to an international financial crisis. On July 31, 2011, President Obama announced a bipartisan agreement on deficit reduction and some flexibility around the debt ceiling.

Stock markets stalled after a yearlong rally but US treasuries which were at risk of a downgrade rallied through the 1st half of 2011 while fraught negotiations were ongoing. It is difficult to attribute factors for the volatility in equities and credit given that Europe was undergoing its own sovereign debt issues.

On Aug 3, a day after the debt ceiling deadline, the national debt surged almost a quarter of a trillion USD, to over 100% of GDP for the first time since WWII, and a few days later, S&P downgraded the US from AAA to AA+. US treasuries rallied with 10 year yields falling from 2.5% to 1.75%, and stock markets across the world sold off and credit spreads widened. It all made perfect sense. The sovereign issuer had been downgraded, the national debt had ballooned, and demand for US treasuries rose. Meanwhile, demand for private assets, fell.

Yesterday, 23 Aug 2017, Donald Trump brought up again the subject of the debt ceiling and the potential shuttering of the US government. Congress needs to approve a budget as well as raise the debt ceiling by 30 Sep. Trump has signalled that he wants his Mexican Wall to be included in the budget, that same wall that the Mexican’s were supposed to pay for. And if he doesn’t get what he wants, Trump has threatened to veto the bill. “One way or another, we are going to get that wall”, vowed Trump. Yet earlier this year, Trump was still insisting that Mexico pay for their own wall, if indirectly through import tariffs, a somewhat self-defeating strategy. Now it appears that Trump is looking for alternative finance for the wall, and that is the US taxpayer, less indirectly. Perhaps some of the investment bankers on his residual team could come up with creative conduits so that the American money paid to Mexico could be channelled somehow into the budget to fund the wall. If tariffs can raise sufficient revenue and be earmarked especially for the wall, it might all work.

In the meantime, Paul Ryan has said that Congress would rather not shutdown the government. And with Trump’s receding approval ratings, and Senate and House elections in just a little over a year (Nov 2018), the Republicans will be careful not to come across as obstructive, especially since they control the House, Senate, and to the extent that anyone has any control, the White House.

6 years ago Democrats and Republicans came together to craft a deal, imperfect, but a deal. It resulted in a sovereign downgrade and some market volatility, although ironically, the downgraded instrument rallied hard. We therefore have somewhat of a guide as to what could happen if there was a Mexican stand-off; between Republicans in the White House, Republicans in the House and Republicans in the Senate.

How concerned should investors be about the current situation? Probably not very. The debt ceiling is academic. The budget determines the debt issuance, not the ceiling. A default by the US government would have sufficiently serious consequences that it would not be allowed to happen, especially since it is a technicality. Imagine if the most widely used collateral in secured lending markets defaulted. The implications would go well beyond American borders. Technical solutions would be found to avert a default, some of which were tabled in 2011 which would not require endorsement of the executive.

US treasuries would probably rise, as they did in 2011 before and after the deadline. This may seem irrational but the value of a security is what everyone agrees it is. There is little intrinsic value to all the paper claims that comprise the liquid markets.

The equity and credit markets might fall given lofty valuations, but mitigating this could be that this is not a new experience. The S&P500 fell 18% during the 2011 standoff, but this was the confluence of the novelty of the debt ceiling negotiations as well as economic troubles in Europe. Lower bond yields would relieve some of the relative over-valuation of equities which might provide some support. They would have the effect of a de facto rate cut. In the extreme case, the Fed may even cut rates or belay balance sheet normalization, resuming liquidity operations to support asset markets.

On the downside, the S&P trades at 21X today versus 16X in 2011, suggesting a 24% downside if multiples revert to those levels, more if they overshoot. This calculation should be discounted as equity markets are hardly scientific or rational in the short term, and the analysis is somewhat crude anyway. If confidence prevails, equities might dip and resume their climb. If confidence fails, even if the Republicans tame their President and find an amicable budget solution, equities could fall more than 24%.

In 2011, a Democrat in the White House faced off against a Republican Congress, but one had the sense that both sides would be strenuously resolute, but responsible and rational. Today we have Republicans in each pillar of government but an erratic President who has no qualms about alienating his partners in the House and Senate. So far, faced with stern resistance from his Congress Trump has always backed down or been thwarted but there may be limits to how much disappointment and ignominy he can endure.


It is always a difficult time to invest. Are equities and bonds overvalued?

It is always a difficult time to invest. When markets are turbulent and falling, investors will tell you it’s a difficult time to invest. When markets have been rising on low volatility for as long as the current market has, investors will tell you it’s a difficult time to invest.

Why is it such a difficult time to invest when volatility is low and markets continue to rise gently? Surely these are ideal conditions for investing? Central banks have underwritten the markets for 8 years now, and even as they lessen their accommodative efforts, they do so to enable further accommodation down the road should the economy weaken. The fact that they consider conditions sufficiently robust to lift their foot of the accelerator is surely reassuring news. They are far from slamming on the brakes. The financial system which had become acutely stressed in 2007 has been repaired and is ready to resume normal service. Growth has recovered almost universally, and even international trade has rebounded and with it global manufacturing. Economic conditions look healthy. Even the chronically lethargic Eurozone has caught up and is currently outrunning the US.

Investors are worried about valuations and they are right to be concerned. Equity valuations are as high, higher in some cases, than they were in 2007 just before the crisis. The S&P500 for example trades on 21X earnings whereas it traded at around 18X pre crisis. Eurozone equities are also trading above pre crisis valuations as is India. However, equities are not universally more expensive. Nasdaq is actually cheaper today than it was 10 years ago. Chinese equities, whether listed in Shanghai or Hong Kong are also cheaper today than 10 years ago. The dominance of US companies and markets skews valuations so that taken in aggregate, equity markets are expensive.

When equity valuations are seen in the context of alternatives or opportunity costs, the picture is more nuanced. The equity earnings yield premium over 10 year US treasuries finds that equities were extremely cheap in 2011 and have become more expensive since then, but remain probably in the region of fair value to slightly cheap, certainly cheaper than they were in the years 2003-2007.

Comparing equity valuations relative to investment grade credit also finds that equities are not overvalued. In fact they may be an indication that corporate investment grade is overvalued. The same is seen when compared with corporate high yield.


Are equities expensive? 


Are equities more expensive or corporate investment grade bonds?  (High is cheap, low is expensive)

Which is more expensive, equities or corporate high yield? 


Which brings us to the complaint that bond markets yield little value. Economic conditions are healthy and corporate balance sheets have reasonable leverage. Barring some areas where leverage has surged, notably China, leverage is closely monitored and as a result companies are less likely to lever up irresponsibly. China, by the way is a bit of a special case as the leverage has increased most where the lenders are state owned and the borrowers are state owned; one might call it off-balance-sheet QE. And even here, the PBOC is trying to ‘normalize’ its policy. In the US, the Fed is clearly of the view that corporate America is able to operate under normal conditions as opposed to the ‘intensive care’ of the past 8 to 9 years.

Investors’ concerns lie not so much with fundamentals but with pricing. HY spreads are at their tightest since the crisis and IG spreads are not far off their lows (achieved in 2014). When it comes to floating rate paper, the spreads are even tighter. Fears of rate hikes by the Fed have driven investor demand for leverage loans resulting in desperate buying.


US credit spreads are tight. But leverage is receding. 


Now there are ways to eke out a higher return, sometimes even at lower risk, and one can invest in hedge funds which take advantage of mis-pricings through arbitrage or relative value but alternative investments have alternative risks.

In fixed income, one can venture into the ABS market. Non-agency RMBS has done well and the nascent agency credit risk transfer market is another attractive area. Structured credit is another area where value can still be found. Subordinated bonds and preference shares are another potential area to hunt for returns. But with each basis point of additional yield comes additional types of risk. It is not that one should embrace the risks or dismiss them but that nothing is for free and the investor must satisfy their own understanding of the risks.

In the area of hedge funds, years of central bank policy has raised correlations and dampened volatility, a one-two knock out to traders seeking to buy cheap assets and short expensive ones. Even cross capital structure arbitrage yields acutely low unlevered returns forcing hedge funds to either leverage up (assuming their prime brokers or investors will let them), or print a lower return. Central bank policy has also confounded traditional transmission mechanisms between policy, the economy, and asset markets delivering global macro funds a particularly difficult environment.

As for systemic risk and investor complacency, we recall an old chart showing both VIX and SKEW. VIX is a widely accepted indicator of investor confidence or complacency. Of late, VIX has fallen to historically low levels and seemed impervious to events of economic and political significance. SKEW, however, shows that post 2008, investors have in fact been sceptical if not cautious. VIX has been depressed by volume call writing and SKEW has been lifted by volume put buying. The divergence between SKEW and VIX are hardly a sign of complacency. Rather it is indicative of the vigilance and worry of at least a segment of investors that has pervaded markets since the crisis as investors brace for the next bust.


Complacency or vigilance? Optimistic investors will not over-supply calls or over-demand puts. 


The only thing once can be pretty certain of in investing is that your wealth will not be the same as when you started. With some diligence and intelligence it should grow at a reasonable pace not far from the rate of growth of the economy or corporate profits. In the short run, volatility will dominate trend and in the long run the reverse is true. It is important for an investor to define their own style of investment and to maintain a consistent strategy lest one is repeatedly whipsawed by the market. Traffic in lower quality assets and one has to be nimble. Invest in higher quality assets and one has to be patient. It is extremely difficult to monetize both noise and signal. To make things a little easier.


*All chart data sourced from Bloomberg