1

OPEC Is Managing The Oil Market Poorly. Oil Prices Likely To Rise.

OPEC is doing a terrible job of managing the oil price. The oil price prognosis depends on the time frame. In the very long run, oil will no longer be a viable fuel for a planet facing global warming. In the very long run, demand will disappear as cleaner, more sustainable sources of energy are found. In the long term, as opposed to the very long term, oil prices can be expected to rise. Why? Demand is fairly stationary but supply is constrained and current prices are too cheap. As a result, there is insufficient investment in capacity and long term extraction costs will rise as cheap and short cycle oil is increasingly depleted. Now for the short term. OPEC and in particular Saudi Arabia wants a higher oil price, mainly so they can flog a piece of Aramco and put a price on it. Last November, OPEC announced production cuts which caused a bounce in the oil price, a bounce sufficiently high that US shale producers were able to sell forward their production to service debt to invest in more short cycle production capacity. While US shale is about 5% of global production, the market has chosen to focus on it, following rig counts and crude, gasoline and distillate inventory changes, mostly discounting good news and sagging on bad news. OPEC meets May 25 and is expected to announce an extension of production cuts. This may support the oil price in the short term. However, feed the market what it wants and it will demand more. More cuts will be sought, more rhetoric, more assurances, more action, just to keep the oil price where it is. Any sign of hesitation and oil prices could well sell off.

This is not about production or commercial strategy, this is public relations. And OPEC is making a right mess of it. If OPEC wants to support the market and bring it into balance long enough to flog Aramco, the most logical thing to do is the following.

1. Call a closed door meeting to cut production but do not announce a production cut. Discuss technical issues and issue no signal to the market as to production plans.

2. In the OPEC report, inflate production numbers so that a gap is created between reported production and production estimated from other sources.

3. Deny that capacity has been reached and that there is a shortage of oil. It doesn’t matter if no one is alleging that OPEC is near capacity, just deny it.

Commodity markets are like any other market. They will assume the worst, that Saudi Arabia and OPEC are at capacity and unable to supply global oil demand. Within 6 months, oil will be 100 USD. By then, the long term demand and supply situation, the underlying fundamentals, will support the temporary fiction that there is a shortage of oil.


Why Is Volatility So Low? Is It Complacency? No Its Not.

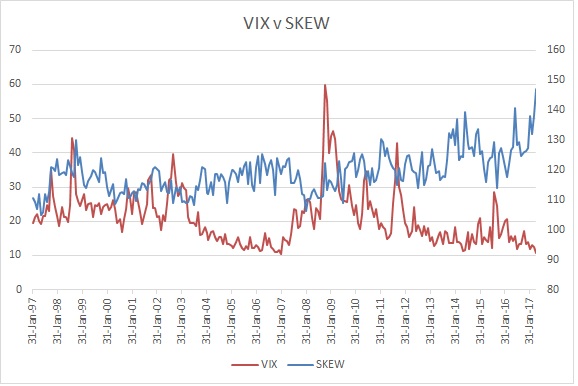
VIX, an indicator of implied volatility for the US stock market, has been chronically low, and surprisingly low given the geopolitical and economic concerns in the economy. Market consensus is that the US stock market is expensive and that growth may not be as strong as expected, especially if the expected fiscal stimulus policies of President Trump are not implemented.

VIX, however, gives an incomplete picture of market sentiment. The low level of VIX leads some investors to regard the market as complacent and therefore prone to sharp corrections. An alternative, or more accurately, complementary indicator, is SKEW. This measures the skew of the option volatility surface. Put simply, a high skew is an indication that put implieds are higher than call implieds, in other words, put options are more expensive and call options are cheaper.

Take a look:

Skew is high even though VIX is low. One possible explanation is that call writing by dividend and income mutual funds and exchange traded products is over-supplying call options while investor caution is over-demanding put options. If this conjecture is correct, it is an indication that investors are far less complacent than indicated by simply looking at VIX.

The market could grind higher for longer.


Leveraged Loans. Asian Private Banks’ Latest Blockbuster Product. Late To The Party… With Leverage.

Fears of rising interest rates have motivated Asian investors to buy leveraged loans. The first real demand from Asia for leveraged loans came around the Taper Tantrum in 2013. The asset class did as it was intended and protected capital while delivering a rather unexciting return (as it was supposed to do.) Over-investment in the asset class, through ETFs and retail mutual funds led to a reversal as capital exited the asset class over 2014 and 2015 resulting in mark to market losses.

Some point to the distress in the high yield market due to the crash in the oil price but note that oil is very under-represented in the loan market. The sell off of 2015 was a technical sell off driven by over-investment in the asset class by less well informed investors. The sell off reached its apex in early 2016 when most retail money had left. Institutional capital, it should be noted, had been returning to the asset class well before this and was positioning for a recovery. 2016 saw the loan market rebound (performing loan prices which had traded into the low 90s, rebounded to par).

Today, 75% of performing loans trade above par. This is not ideal for an obligation which can be called, repaid or otherwise repriced basically on any given day. Indeed in a trillion USD market, 2016 witnessed some 100 billion USD of repricings, all occuring in the last months of the year. Repricing volume in 2017 matched all of 2016 in January alone.

In a repricing, the borrower basically renegotiates the loan at a lower coupon, with the lender, who either agrees or faces early repayment of the loan, usually with no penalty fees.

And now we get to an interesting product in the Asian market. Private banks are selling leveraged loans packaged in the form of Fixed Maturity Products. With leverage. The typical product will lock the investor in to 3 to 4 years, be invested in a pool of leveraged loans, and be leveraged between 3 top 5 times.

1. The timing is not ideal. Buying loans above par is not ideal when they can be repriced or repaid at par. And a large proportion of loans are today trading above par.

2. The structure is not ideal. Loans are low yielding, low volatility, fairly predictable credit investments. They naturally lend themselves to leverage. But if that leverage removes some of those features such as the low volatility and predictability, then it defeats the purpose of investing in loans. The ideal structure for leveraging loans is a structure whereby the loans are financed by fixed maturity liabilities with limited recourse and no mark-to-market of the underlying collateral. Pricing is based on default, recovery and basically on the actual cash flows of the loan pool. This structure has a name: the CLO or Collateralized Loan Obligation. The CLO has a bad reputatation, all of it by association. CLOs not only survived 2008/9 but outperformed stocks and bonds. Leveraging a pool of loans with a bank credit line, with the usual loan to value covenants and margin requirements, is to create an unstable cousin of the CLO.

There are a few possibilities why wealth management firms would construct and offer a leveraged product packaging loans in this fashion.

1. They cannot sell CLOs to an unsophisticated audience because the audience is unsophisticated and would not understand the benefits, or because the regulator would not allow it, or would take a dim view if the CLO later became impaired.

2. They cannot produce CLOs for whatever reason. For a bank, in-house production is ruled out by the conflict between risk retention rules and capital requirements although one cannot be sure if they got that far. Outsourcing CLO production would not have addressed the complexity issue since the bank would have had to conduct a comprehensive due diligence, and would have involved sharing of fees as well.

3. The product development progressed without realizing the CLO alternative, which would have been quite clever, but still leaves the collateral mark to market issue inresolved. Note that in the CLO space, market value structures no longer exist, a victim of mark to market and automatic deleveraging.

Caution is therefore recommended. The timing of buying leveraged loans is not ideal, and the structure of the leveraged vehicles is not ideal. Even a stable asset like leveraged loans has occasional volatility (2008, 2011, 2015) and while models can be built to estimate losses and deleveraging levels, too successful a product can create a feedback loop when prices fall.

If there is any doubt that market prices have outpaced fundamentals, consider this. Over a 12 month period ending 10 May 2017, the S&P LSTA Index of loans has returned 8.04% whereas the Blackrock Floating Rate Income ETF (FRA) and the Eaton Vance Senior Floating Rate ETF (EFR) have returned 16% and 21% respectively.


Why The Slowdown in Q1 Economic Growth?

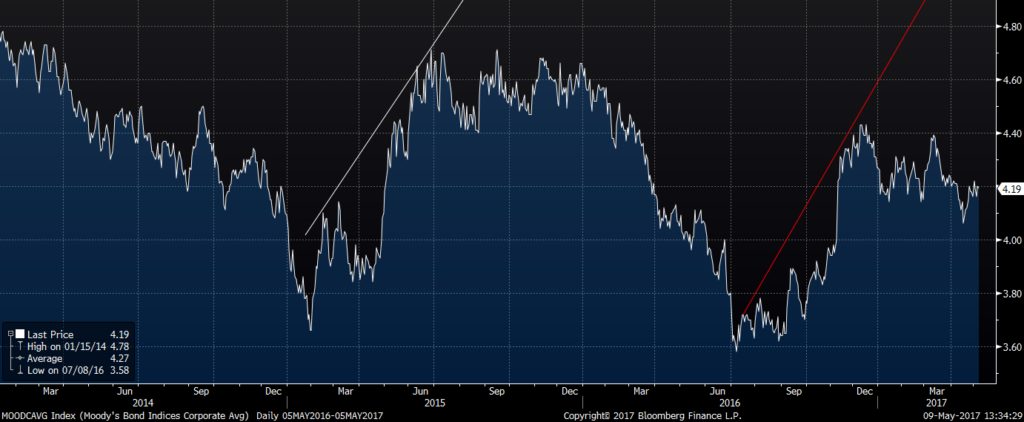
The following is a chart of the Average Yield for US Corporate Bonds. The period of early 2015 indicated by the white line coincides with a slowdown in US manufacturing PMIs.

* chart data source Bloomberg

Since mid June 2016 we have seen corporate bond yields rising as a result of rising US treasury yields, reflecting an improving economy. At the same time we have seen credit spreads compress, but not enough to make up for the rising treasury yields.

Come November and Trump winning the US Presidential Election, US treasuries spiked higher, raising the total debt financing cost for US corporate borrowers. The hike is equivalent to a 50 basis point rate hike (softened by some compression in the credit spread), and taken together with the fact that yields had been rising since July, businesses were facing increased debt financing costs of over 1%. That’s bound to put the brakes on growth to some degree.

The Fed meets in mid June, a month and a half away. The probability of a quarter point rate hike is 92%. Corporates, however, don’t all borrow at the short end. The impact on longer maturities is likely to be distributed and moderated. The signal that the Fed would be sending, that the economy was in good health, will likely compress the credit spread a little more, softening the blow.

But if an explanation is sought for the recent slowdown in growth, and to put it in context, a very moderate slowdown it is, look no further than that financial conditions have tightened, ironically on expectations that Trump’s policies would turbocharge growth and inflation.


Growth Rebound Within The Limits of Trade War

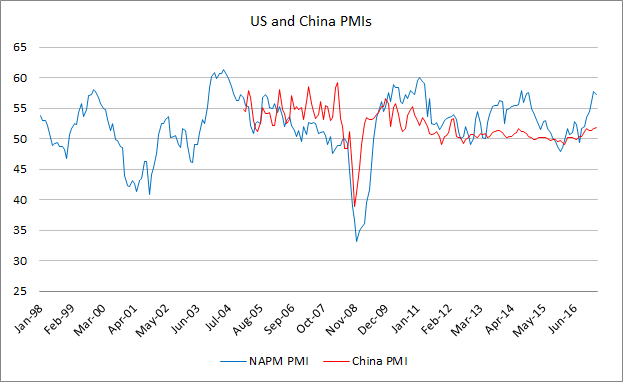
From 2004 till 2008, US manufacturing (as measured by the NAPM PMI) has been weak, before diving in 2008. Since then it has rebounded and fallen into a range of 50 – 57, steady if not robust expansion.

In China, manufacturing was flourishing pre 2008, after which it declined steadily from over 55 to below 50 in 2011. It has flirted with 50 since then until early 2016 when the China went into QE lite mode and resuscitated the economy.

2016 appears to be the year of a synchronized global manufacturing recovery. Even chronically troubled economies such as Europe and Japan witnessed a rebound in PMIs around mid 2016.


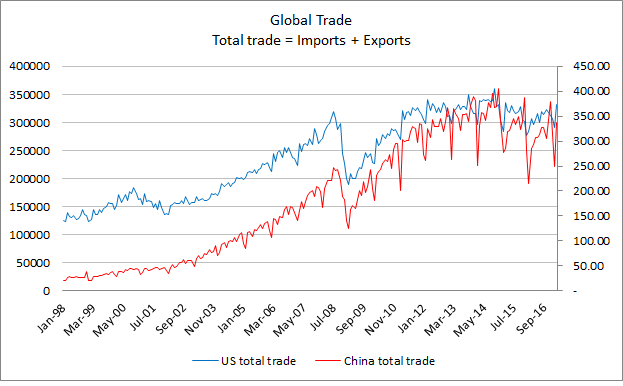
Before 2008, US trade policy was dominated by efficient production with the current account relegated to a state variable. From 2009, with most avenues blocked, the US, and indeed most countries in the world, attempted to export their way out of recession. The result was trade peaking in late 2013, early 2014.


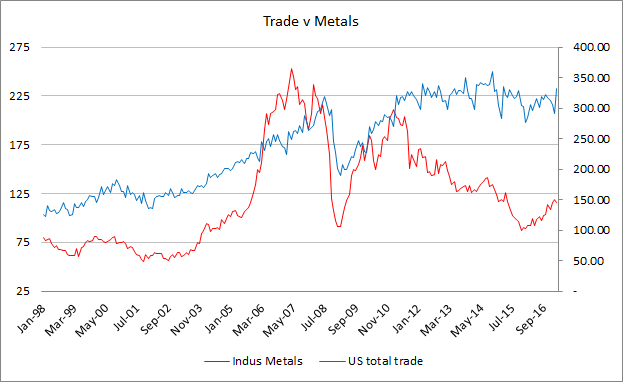
A consequence of this Cold Trade War was a recession in manufacturing and industrial commodities. In 2016, global manufacturing had re-adjusted itself to more domestic facing production. This has been responsible for some of the recovery in manufacturing and the recovery in commodities.


How far can the current recovery extend before it once again meets the limits of decreased trade?

For the US, PMI’s fell as productive capacity was offshored pre 2008. From 2010, PMI’s have been supported by reshoring. However, loss of trade is also a loss of productive efficiency. Eventually, trade stagnation will lead to loss of productivity and to falling output growth. The question is how long the gains of reshoring can persist before inefficiencies set in.


*all data sourced from Bloomberg.